Most common types of Machine Learning
Before continuing further, let's define to key terms which will be needed in this lesson and within the whole course: an algorithm and a model.
An algorithm is a mathematical or statistical equation.
A model contains an algorithm that has been trained using data. Another way to express this is to say that the model has been fit to the data. After the training/fitting is done, the model can be used to make predictions on future data.
So when you face a problem that you want to solve using machine learning, you choose an algorithm. Then you train the model using data.
Three major types
Three most common types of machine learning are:
- Supervised learning
- Unsupervised learning
- Reinforcement learning
The categories cover the most commonly used machine learning types, but it should not be seen as a definitive list. You may, for example, read about semi-supervised learning, which is a hybrid of supervised and unsupervised learning.
Recap: Machine learning is a study covering methods of making a computer learn. Instead of being explicitly programmed, the machine learning maximizes its performance progressively (based on experience, E).
Supervised learning
Supervised learning is the easiest type of machine learning to understand and to implement. Supervised learning models can be further separated into two groups based on their approach:
- Classification
- Regression
Classification models are able to predict between two or more classes. You will use a classification model when you need to find out in which category does an object belong to. Binary classifier would have only two mutually exclusive classes: [spam, not spam] or [ill, well] or [dog, rabbit]. An n-class multiclass classification model will learn to predict n amount of classes: [1,2,3,4,5,6,7] or [background, dog, cat, person, ball].
Regression models are able to predict a continuous-value attributes. The output is often a float-point number such as 12.53255. The attribute which is being predicted could be, for example, life expectancy in years, housing price in thousands of dollars, annual profit of a company in dollars.
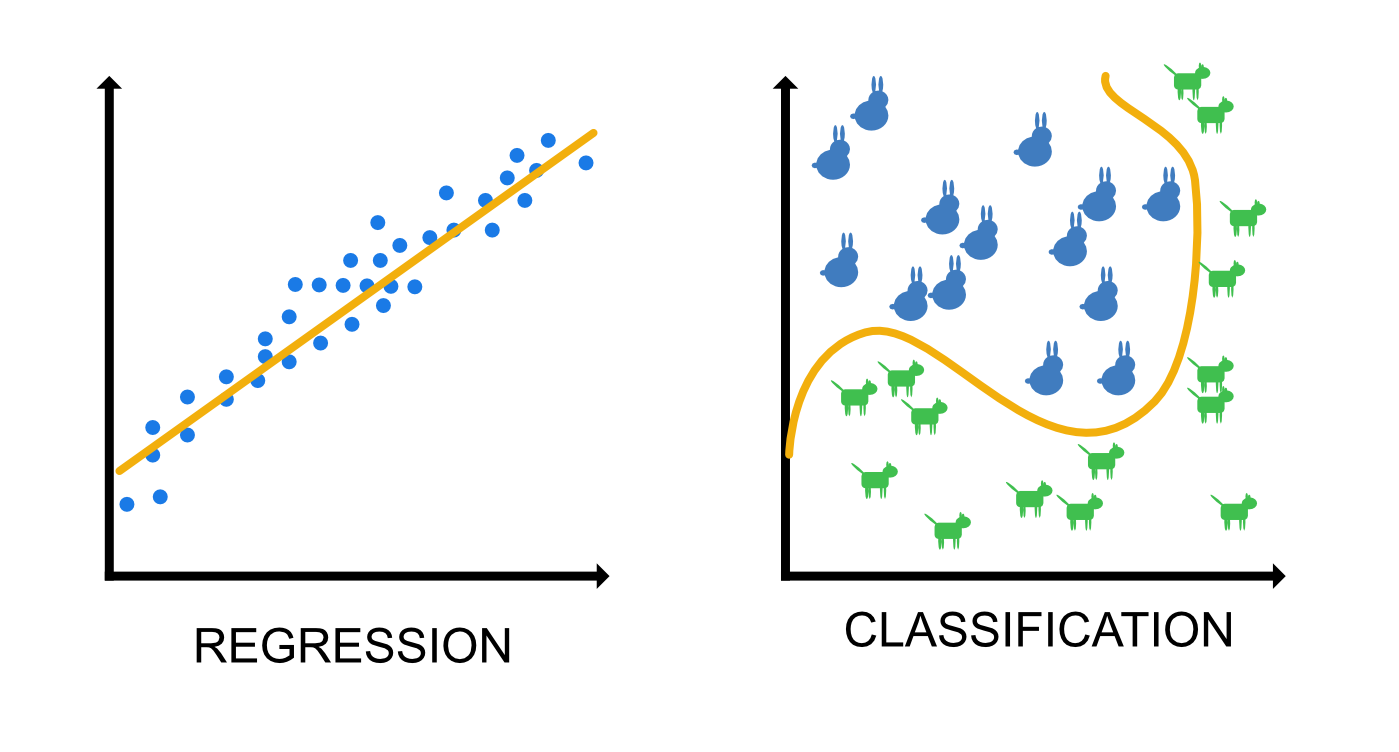
In the graph above, you can see simplified regression and classification examples. In the regression example (left), the predicted value is the house price in dollars. The x-axis would be some feature of the house, for example the area in square meters, and y-axis would be the price. In the classification example (right), we are classifying dogs and rabbits. Both the x and y axes would be features of the animals, say, the body weight (x) and the length of the ears (y).
The given examples are using just one or two variables. Don't let this fool you into thinking that supervised learning wouldn't be a powerful tool. By selecting multiple, meaningful features, a supervised learning model can outperform a human in prediction tasks, especially when using deep neural network models. Note also that a good algorithm isn't enough; you need a lot of meaningful data that has been labelled wit high precision. Labelling (often) involves human input and can be a time-consuming task.
Unsupervised learning
Unsupervised learning is the very opposite of supervised learning. In unsupervised learning, you will not rely on learning from labelled data. In fact, you most certainly will not have any labels at all if you are planning using unsupervised learning algorithms. Instead, the algorithm is data-driven and it will extract insights based on the dataset. Unsupervised learning applications include clustering data, anomaly detection and dimensionality reduction.
Clustering data may be useful in many kind of applications, such as in market segmentation. Clustering can be used for finding segments of customers. These segments are groups individuals with similar characteristics or behavior. Various marketing strategies or approaches can be used for different kinds of groups.
Reinforcement learning
Reinforcement learning systems learn by interacting with the environment. The action will change the current state of the environment and produce some reward. Learning happens as a "loop of trial and error". A number of iterations later, the system has learnt to maximize the long-term reward by taking actions based on the current state of its environment. Imagine an insect trying to find its way out of a maze, while being rewarded with honey when performing correct turns.
Reinforcement learning is useful in dynamic environments, such as in games and automated stock market trading.
Conclusion
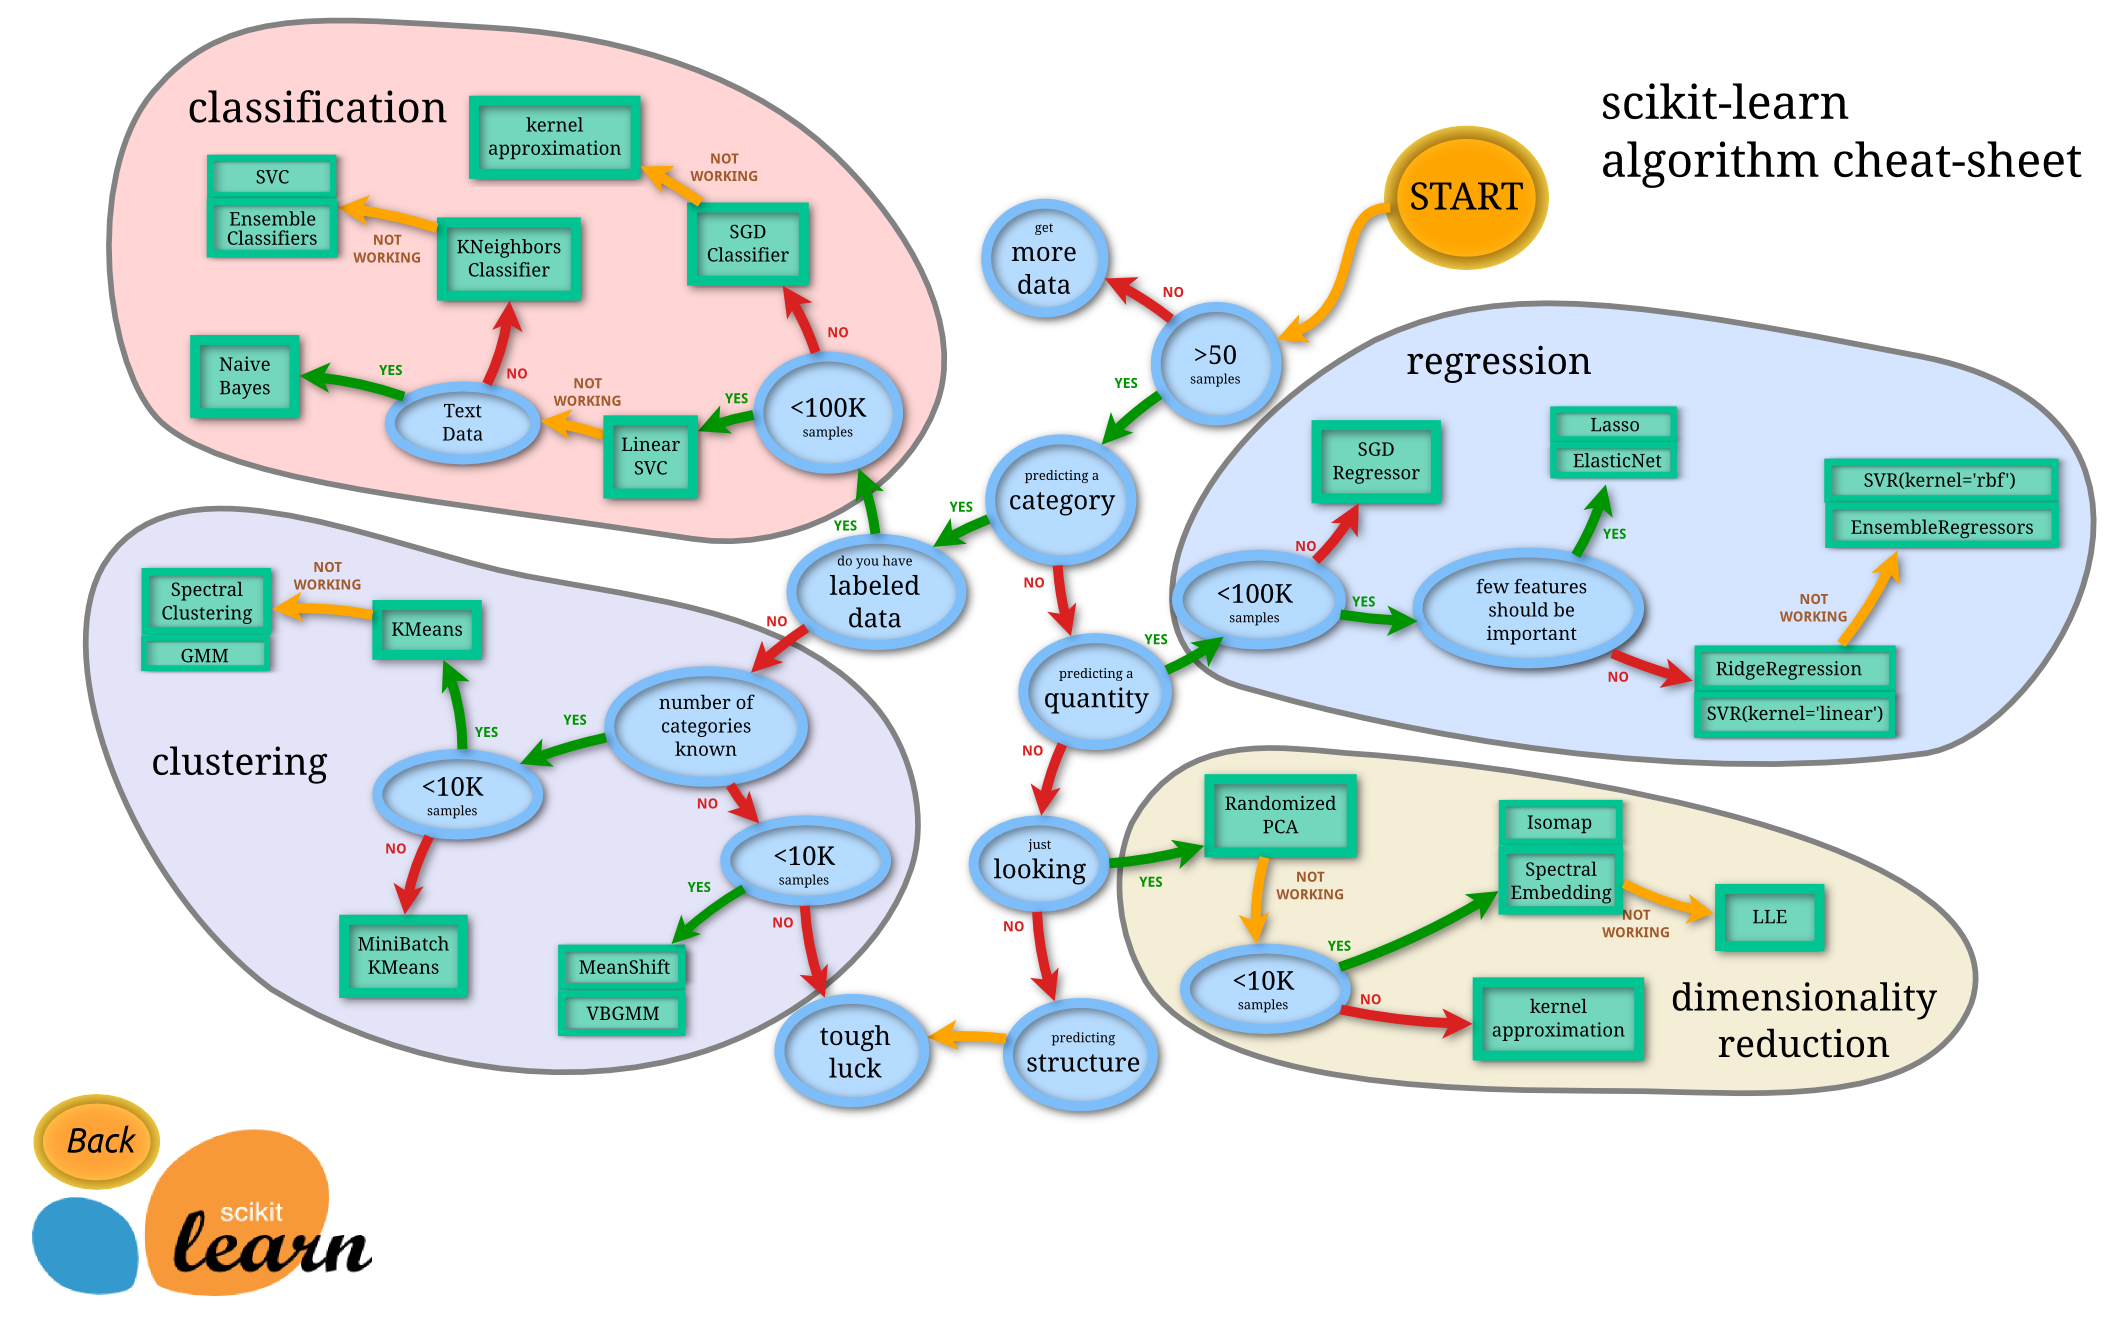
The map (or a decision tree) above is taken from scikit-learn's website. Examine the map closely. You do not need to recognize the names of the algorithms yet, but following the paths in the map should give you a rough understanding on how the problem and the data affect the algorithm selection.
Task 1
Below is a list of various problems that could be solved by using machine learning models. Similar or same questions may appear in the tests later on. On each problem, find out if the task at hand could be solved using a machine learning. If it can be solved, which type of machine learning would you use: supervised, unsupervised or reinforcement learning.
Problem 1: A dataset consists of newsgroup posts and their labels. The labels are topics (such as sports, games, arts, …). You need to create an application that will predict the topic of a newsgroup post that does not yet have a topic (based on the body text).
Problem 2: A dataset consists of parameters of greenhouse data of roses [temperature, humidity, light intensity…. growth per day]. You need to create an application that will predict how much a given rose will grow per day.
Problem 3: A dataset consist of cat images. The images are 50x50 pixel RGB images with no other data. You need to create an application that will predict if the cat likes a certain brand of cat food.
Problem 4: A dataset consist of metrics of a server [CPU temperature, HDD temperature, HDD load, …]. You need to create an application that will warn if a server is behaving unusually. (Who knows, maybe these strangely acting servers are either under attack or about to malfunction!)
Problem 5: There is no dataset, but there is a virtual environment: Pac-Man game. You need to create an application that will learn to play the game.
Problem 6: A dataset consist of body measurements of customers [sitting height, waist, chest, shoulder, …]. You need to create an application that returnss median measurements of 5 groups of customers in order to design five different shirt sizes (XS, S, M, L, XL).
Task 2
Open up the PDF book you have saved: A Brief Introduction to Machine Learning for Engineers (v3, 2018). The book can be downloaded as PDF from: https://arxiv.org/abs/1709.02840 (2.13 MB.) Then, read the pages 9-14 (Starting from 1.2.1 Learning Task, ending to the end of Part 1).