Classification
By now, you should have a fairly robust idea of what a machine learning model can realistically predict. If you have forgotten whether classification is supervised or unsupervised learning, read the lesson material again.
Instead of focusing solely on theory and terminology, we will now look at what does a single classification algorithm actually do. The algorithm we are focusing on is k-NN (k-Nearest Neighbour). k-NN is a very simple non-parametric algorithm used for both classification and regression. The model doesn't really learn anything. It merely stores the n-dimensional values of all entities in the dataset. When you perform classification on an unknown entity, the program will calculate the distance between the entity and all other entities one by one. If you have chosen the k to have value five (k=5), the entity will be labelled to the majority vote of the five closest entities. For example, if the k closest entities are labelled as [cat, cat, cat, dog, dog], the entity would be classified as being a cat.
The k-NN assumes that points that are close to each other are similar. A typical way of defining how close a point is to another is to calculate their Euclidean distance. In other words, the straight-line distance between the points.
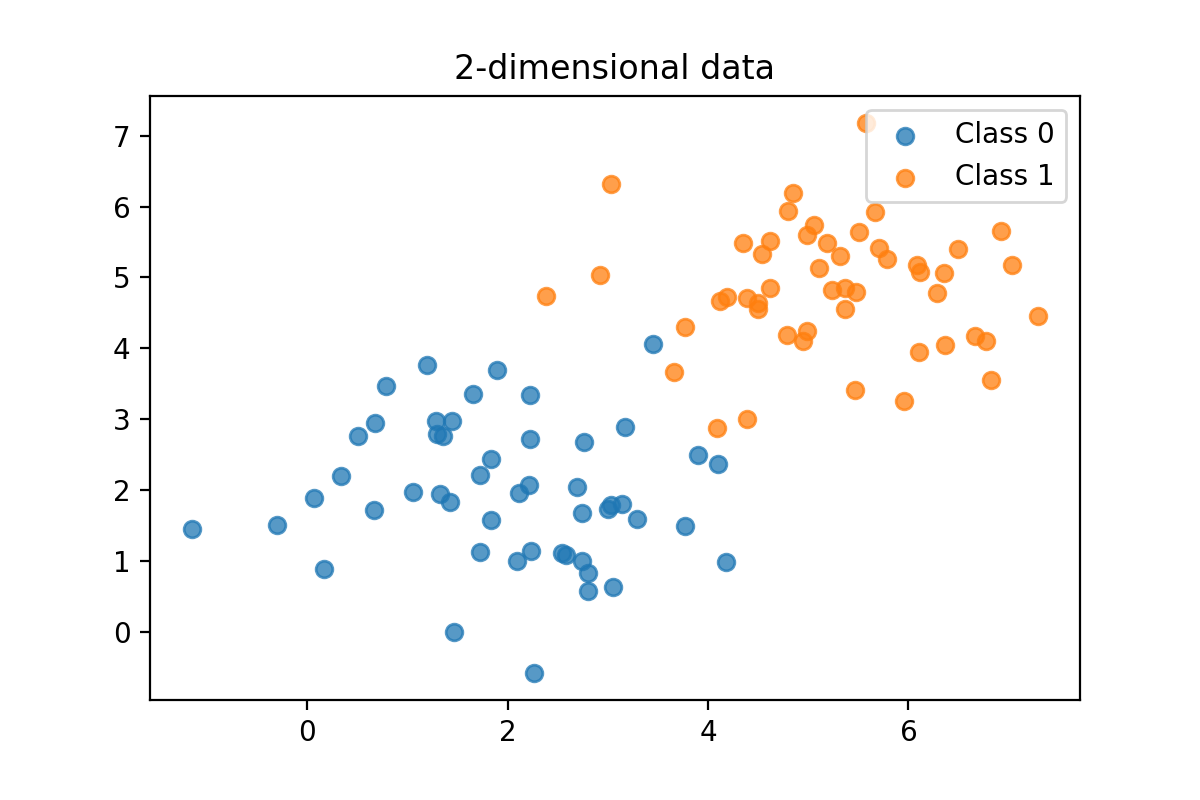
Imagine that a k-NN classifier has been trained using the data shown in the graph above. The dataset consists of 50 points, split into two labels or classes [0,1]. The centers of those clusters are (2,2) and (5,5), but due to the variance in the data, these two datasets overlap slightly.
Food for thought: This classification could not be solved with 100 % accuracy using a straight line as a separator. If this doesn't make sense instantly, try to draw a straight line that will split the graph into 2 groups: orange and blue entities. You will learn that this is not possible. The sets are not linearly separable.
Let's predict the label of an unknown data point.
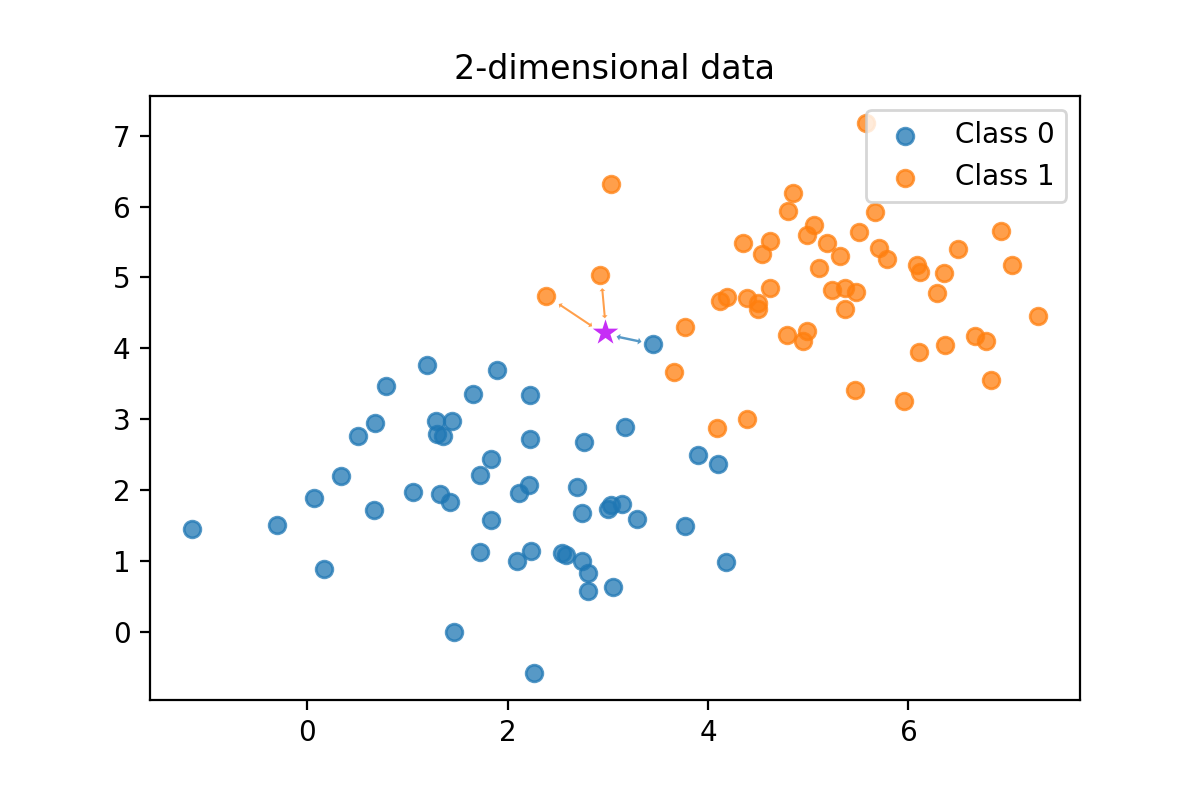
The new entity (x=2.9, y=4.2), which is marked to the graph above using a magenta star, has no label yet. It is an unknown item, and we need to predict the label. Remember that both x and y are features.
- If we use k=1, the majority vote is simple. The closest entity in the trained k-NN model will decide the label of this new entity. Thus, with k=1, the label would be "class 0" (blue color).
- But what if we choose the k=3? The vote will be [0,1,1], so one blue versus two oranges. In this case, the class 1 (orange) will have the majority vote.
Does it work in more complicated cases?
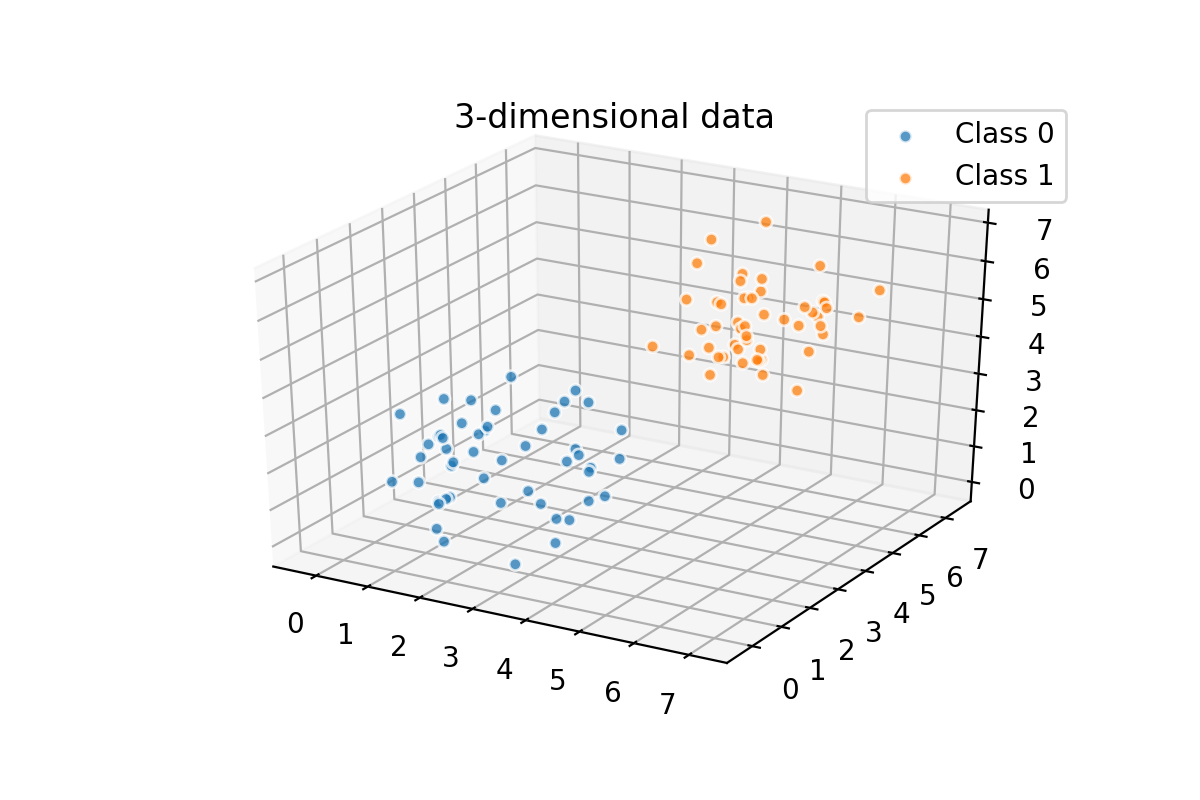
This example is oversimplified, of course. We have only 50 data points. In many cases, the data won't be 2-dimensional either. It could be 3-dimensional like in the graph below. Or it could be n-dimensional, where n is a large number. This kind of data is hard to visualize; that is why we are using 2D as an example. In real-life application, you are most likely going to end up using some slightly more sophisticated algorithm than k-NN classifier. Simplicity is a good thing in many ways, but it has its drawbacks.
- One drawback is that computation time increases linearly with the number of data points. If your dataset has 10 million samples, and you don't perform any operations to reduce their number, the prediction phase will need to calculate Euclidean distance 10 million times before knowing which k distances are the smallest.
- Another problem arises then the dimensionality is high. High dimensionality tends to increase the sparsity of datasets. Compare the 2-dimensional and 3-dimensional graphs. Doesn't the 3-dimensional feel a bit vast? Imagine what happens when we have 20-dimensional data.
Instead of reading theory and working on artificial data sets, let's apply k-NN classifier into real data: hand-written numbers! Can we classify numbers [0,1,3…9] using images as input data? Follow the Jupyter Notebook below to find out.
IMPORTANT! If you have never used the Jupyter Notebook before, spend some time learning the interface. Jupyter Notebook in an interactive environment that allows you to execute Python code using your browser. The Python interpreter is being run on a remote server. To start learning Jupyter Notebook, click the Help -> User Interface Tour. Another source of information is the Jupyter's own documentation: Overview of the Notebook UI.