Bias, Variance and Overfitting
According to Google Machine Learning glossary, overfitting is:
Creating a model that matches the training data so closely that the model fails to make correct predictions on new data.
Memorize our last lessons: fitting the polynomial features to Boston dataset. Then, look at the image below. The image has been taken from Scikit Learn documentation. Here is the code that created the graphs.
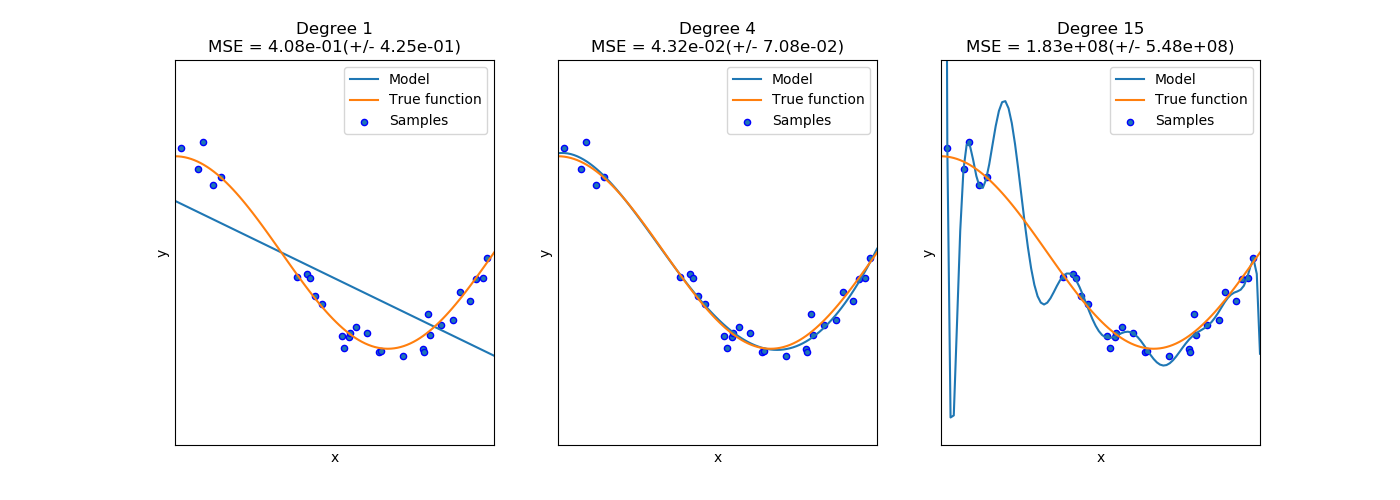
Adding more features to a model will increase the complexity. Increasing complexity will increase the chance of overfitting. Whether the features are real measurements or created using various data engineering methods (such as using the polynomials of current features), the problem remains the same.
The only exception to this are sparse features (such as categorical features turned into dummy variables). They are less prone to overfit. Zero-features don't really count into the complexity of the model.
Bias and Variance
Notice that no matter how you fit the model to the data, it will always have some balance between overfitting and underfitting. This error of generalization (which is the ability to predict the unseen data) can be expressed using bias and variance. There is a trade-off between these two.
Bias is the error caused by making wrong assumptions (such as that the linear line is enough - we've seen this with Boston dataset). If you would train your data multiple times on different subsets (or folds) of the training data, the error will remain high. This means that your model is underfitting the data.
High bias is underfitting to training data.
Variance is the opposite. If different subsets (or folds) will have varying errors, your model has a high variance and it likely to overfit the data.
High variance is overfitting to training data.
Between these two extreme cases, there is a sweet spot. We want our model's complexity to hit this sweet spot.
Visual Examples
For this section, we will use a generated dataset. Later on, you can check the Notebook on how the dataset was created. For now, let's avoid the code and focus on understanding the concepts. The ground-truth y has been calculated as:
$ y = w0b + w1x + w_1x^2 $
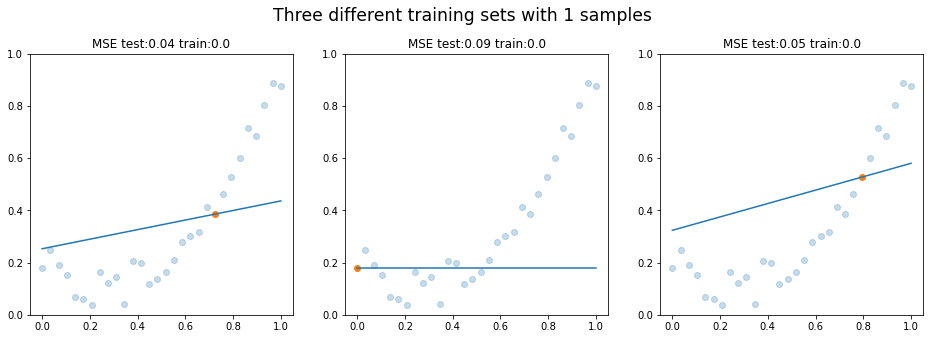
To find the best possible fit, we would have to be using 2nd degree polynomial feature. Let's be nasty and try to fit in straight line! It will surely underfit, won't it? Below is an example of how the model would fit a line using only one training sample. All the rest, 29 samples, are being used for testing. As can be guessed, the training error is 0. Testing error is not.
Predicted Lines using N Training Samples
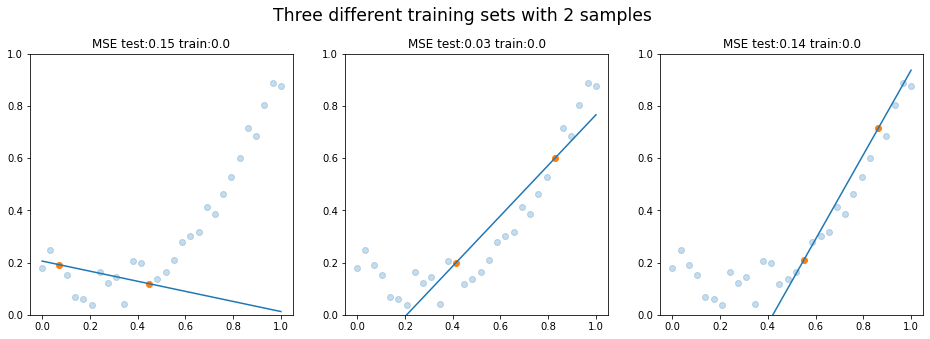
If we increase the n_samples by one, we will fit a line using only two training samples. Notice that the training error is still 0, testing error is not.
Now, what if we use 10 samples? This means that our ntraining is 10, ntesting is 20.
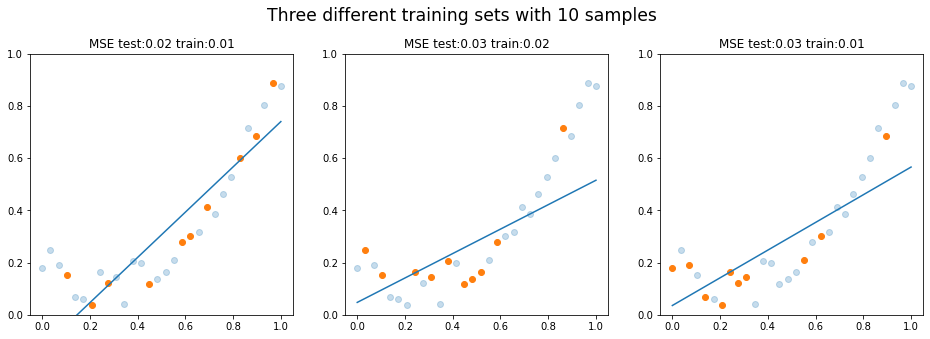
The average test error keeps decreasing and be train error starts to get higher. Does this feel familiar? It should. We have performed a very same operation during our lesson about learning curves. We kept increasing the training size and plotted how error/score is affected by it. Let's do that again.
Learning Curves
Below is a learning curve (training set size vs. error) of SGDRegressor. The dataset is the Boston housing dataset. On the left side, we have polynomial degree of 1 - we are using the original 3 features with no added polynomial features. Each graph to the right adds one more polynomial degree. Thus, the feature counts are: 3, 9, 19, 34, 55.
Note: The original Boston housing dataset includes 13 features. We are only keeping three: INDUS, RM, LSTAT. Other features are less linearly correlated to the house median price. They would require feature engineering such as binning into categories and turning categories into dummy variables.
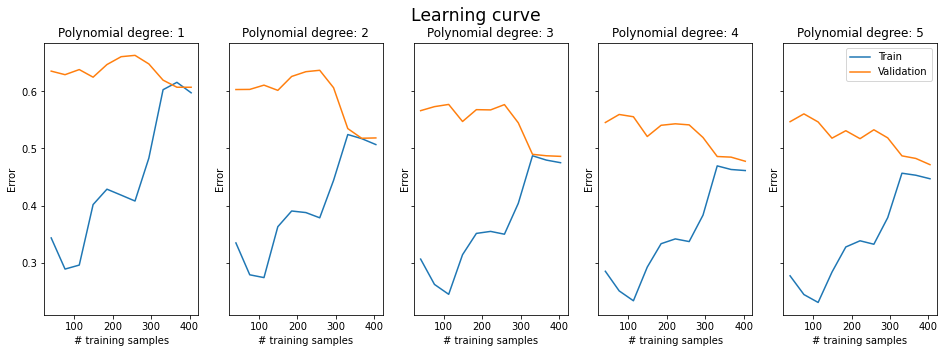
While accepting that we have done some shortcuts in feature engineering, let's have a loot at the learning curves. We already know what adding complexity to a model should move from underfitting towards overfitting.
The left model is clearly underfitting. In other words, it suffers from high bias. The generalization gap is narrow; generalization gap if the gap between the two lines. Each polynomial degree seems to lower our training error and also increase the generalization gap.
If we train the model with 1…7 polynomial degrees and plot the training and validation errors of only the last fold, we will get the graph like below.
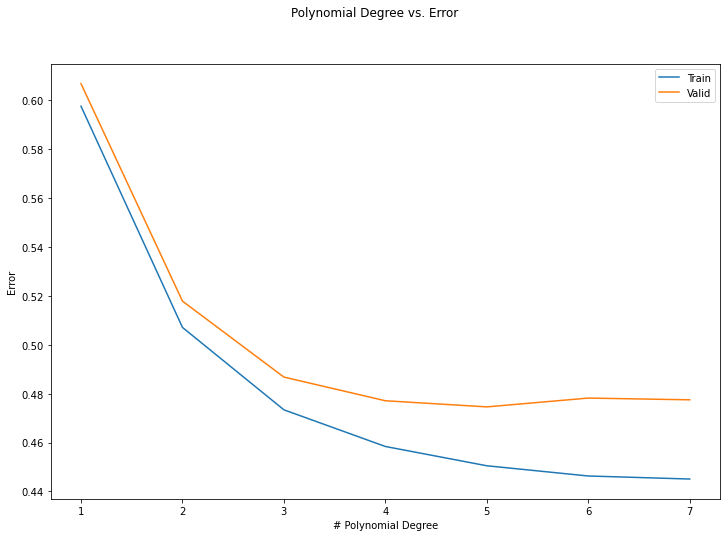
In theory, if your model can deal with increasing amount of polynomials, the training error will get smaller and smaller per each polynomial degree you add up. In other words, increasing the complexity of the model will lower the bias and increase the variance.
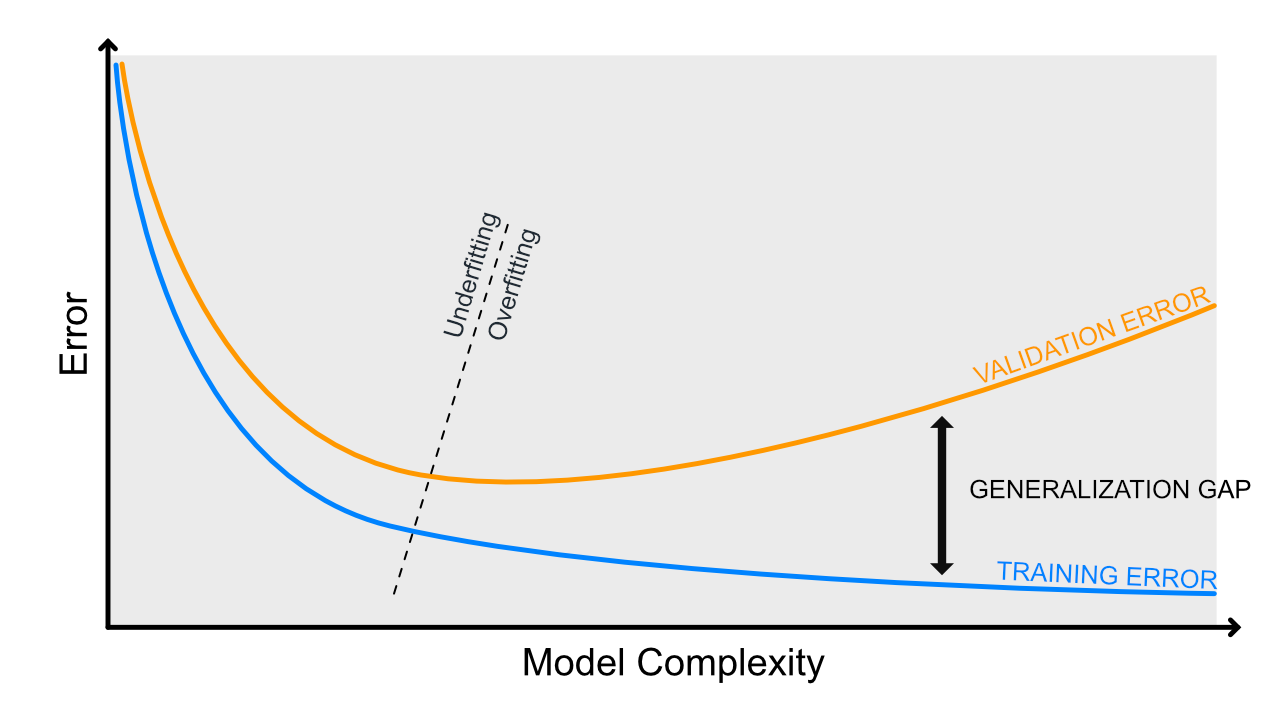
Below is an exaggerated image of the same phenomenon. In real-life situations, you will not usually see this clean graphs. In the Boston case, you might want to stop the polynomial degree at 3 or 4. Having that said, we are only using 3 of the original 13 features. We would need to perform some exploratory data analysis and check what features do we want to keep and what require some other preprocessing than the typical standard scaling. Good-quality features will improve your model.
Conclusion
| | OVERFITTING | UNDERFITTING | | ----------------------- | ----------------- | ------------------- | | Regularization rate | Increase | Decrease | | # of Features | Reduce the amount | Increase the amount | | # of Samples | Get more data | --- |
The list above is a rough guideline of how you can fix either underfitting or overfitting. It is important to remember that this is a trade-off. Your model will always have some bias and some variance - and the real-life data will have some noise too. What you trying to do is:
- Try to get the training error as low as possible
- …but not so low that the validation error becomes a problem.
If you memorize our lesson about regularization, you should remember that the regularization is "any method that increases testing accuracy (usually at the cost of training cost)".
It is also worth noting that getting more data (samples) sounds like a good fix to overfitting, but often it is not possible or is expensive - otherwise you would most likely already have that data available. Think about the Titanic dataset. Where would you get more data? Our dataset didn't have information from all passengers, but where would you get it from?
In case you need to increase the complexity and tuning the regularization doesn't seem to help, you will most probably need more features. Gaining new type of data has same limitations as getting more data samples. Depending on the problem, you might be able to install a new type sensor to generate new variables into your dataset. Other option is to create new data using the already-existing features. For this, you need feature engineering techniques, including but not limited to polynomial features.