Plot Data with Pandas
Plotting or visualizing data is often used to make the data easier for humans to approach (than lists of numbers). The graphs can be histograms, scatter plots, violin plots, heatmats and many other.
To be honest, this lessons could be called "Visualizing Data using matplotlib". Why? Matplotlib is the plotting library that Pandas is using under the hood. Matplotlib can be very cumbersome to use. The Matplotlib library has been created to mimic Matlab's plotting tools, so if you are familiar with Matlab, you will notice many similarities. Pandas makes visualizing DataFrames fairly easy by giving a higher-level interface to the same tools. DataFrames and Series have a plot method that, by default, uses Matplotlib.
If you need to plot geographical data or create highly interactive graphs, you can use other libraries such as Plotly or Bokeh. Those are beyond the scope of this course, but it is good to remember that there are alternatives you might want to look into, you are interested in data visualization.
In Pandas, your main object are of type DataFrames, Series and Index. In matplotlib, your most fundamental objects are:
- Figure
- Axes
Most often, you will create objects of those types when you are calling subplots.
# This would create a Figure with two (2) Axes objects.
# The Axis object contains
fig, axs = plt.subplots(2, 1)
Of course, one could instantiate the figure first, then a GridSpec object to hold the grid layout, and then add the Axes.
# Create
fig = plt.figure()
gs = fig.add_gridspec(2, 1)
ax1 = fig.add_subplot(gs[0, 0])
ax2 = fig.add_subplot(gs[1, 0])
The output of both examples above is a Figure that looks like:
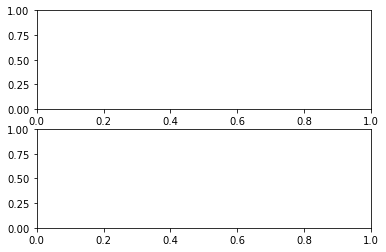
Figure contains the whole graph that you will eventually show on screen. It can be though of as a screen, canvas or container for the Axes objects. The Figure can contain multiple Axes-objects, which are individual graphs such as Axes.scatter, Axes.bar and Axes.pie. Notice that the Axes it not plural for axis when using matplotlib, but the Axes contains: x axis and y axis.
Functional vs Object-Oriented Approach
Having that said, there is a state-based interface that can be seen as a novice alternative for the object-oriented API. This interface is called Pyplot. So your options are:
- Pyplot API for MATLAB-like quick and easy plotting.
- Object-oriented API for full control and customization.
During this course, we will mostly work with the simple pyplot API, but we might combine there two approaches by accessing Figures or Axes objects to perform some minor customization. The Figure and Axes objects still exist, and Matploblib is being used, but our interface for calling such a graph is simplified:
# Assuming df is a Pandas DataFrame object
df.plot.line()
Seaborn
Seaborn is a library that provides a high-level API for matplotlib. It can be used for plotting Pandas DataFrames. Most often, you will see Seaborn being used as a quick way of creating visually pleasing graphs. The same graphs could be created in Matplotlib by hand, but using Seaborn will save us some time.
Conclusion
So, we have multiple ways of plotting graphs. The most used library in Python at the moment is Matplotlib. When using Matplotlib, we have various options, such as:
- Plot by instantiating Figures, Axes and other needed objects manually for maximum control and customization.
- Use Matplotlib.PyPlot. It is a functional, high-level interface for using Matplotlib objects.
- Use the plot() function inside a DataFrame object. Internally, it creates Matplotlib objects.
- Use some other high-level API such as Seaborn.
There is also an alternative to use some other library, such as Bokeh or Plotly. Once again, there can be used directly for maximum control and customization, or, by using high-level interfaces such as HoloViews, Chartify or Plotly Express.