Case study for IoT prototyping - Kamk weather station
This project is a part of the student project, the main goal is to improve a previously built weather station project to include among other improvements, database insertion and new types of sensors.
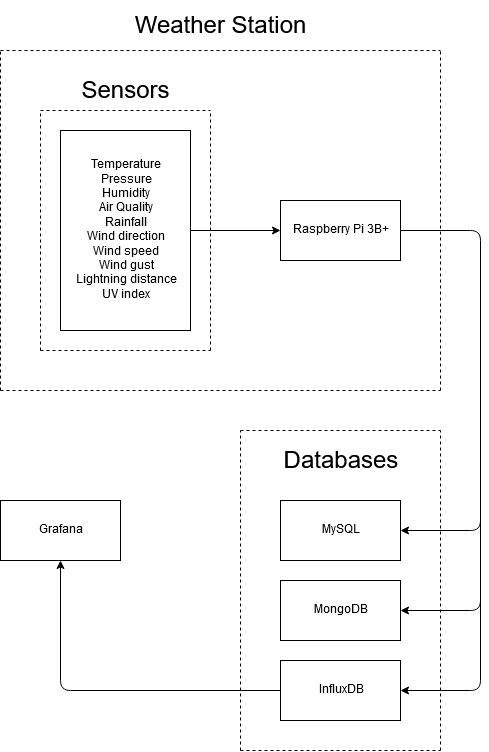
The weather station records the following data:
- Temperature
- Pressure
- Humidity
- Air Quality
- Rainfall
- Wind direction
- Wind speed
- Wind gust
- Lightning distance
- UV index
Lightning sensor to measure distance from a lightning strike and an UV sensor to measure the UV index. The data gathered from all sensors is sent to databases through the local network.
The project uses the following databases:
- MySQL
- MongoDB
- InfluxDB
Weather station data is presented graphically using the Grafana platform. The goal of this project is to use the weather station to gather data for use in educational purposes.

Picture 9. Weather station project overview.
Weather Station Sensors
The weather station includes the sensors listed below. The sensors are arranged to all have their own python classes that are called from a single python script to collect all the data and send it forward to to the three databases using the constructed Database class.
1. - Temperature: DS18B20
The DS18B20 digital thermometer provides 9-bit to 12-bit Celsius temperature measurements and has an alarm function with nonvolatile user-programmable upper and lower trigger points. The DS18B20 communicates over a 1-Wire bus that by definition requires only one data line (and ground) for communication with a central microprocessor. In addition, the DS18B20 can derive power directly from the data line (“parasite power”), eliminating the need for an external power supply. Each DS18B20 has a unique 64-bit serial code, which allows multiple DS18B20s to function on the same 1-Wire bus. Thus, it is simple to use one microprocessor to control many DS18B20s distributed over a large area.
2. - Pressure: BMP085
The BMP085 is a high-precision, ultra-low power barometric pressure sensor for use in advanced mobile applications. The BMP085 is designed to be connected directly to a micro-controller of a mobile device via the I2C bus.
3. - Humidity: HTU21D
The HTU21D is a low-cost, easy to use, highly accurate, digital humidity and temperature sensor. HTU21D(F) digital humidity sensors are dedicated humidity and temperature plug and play transducers for OEM applications where reliable and accurate measurements are needed. Direct interface with a micro-controller is made possible with the module for humidity and temperature digital outputs. These low power sensors are designed for high volume and cost sensitive applications with tight space constraints.
4. - Air Quality: TGS2600
The TGS2600 has a high sensitivity to low concentrations of gaseous air contaminants such as hydrogen and carbon monoxide which exist in cigarette smoke. The sensor can detect hydrogen at a level of several ppm(parts per million).
Due to miniaturization of the sensing chip, TGS2600 requires a heater current of only 42mA and the device is housed in a standard TO-5 package.
5. - Rainfall
Weather Sensor Assembly p/n 80422 is a simple mechanical device used to measure rainfall. Rain is collected and channeled into the bucket. Once enough rainwater has been collected, the bucket will tip over, the water will drain out from the base, and the opposite bucket will come up into position. The exact amount of 0.2794 mm of rain will tip the bucket.
6. - Wind Direction, Speed & Gust
A wind vane works because wind exerts force on its vertical blade, which rotates to find the position of least wind resistance; this position is aligned with the direction of the oncoming wind. Like the rain gauge or anemometer, the wind vane used in the project also has reed switches and a rotating magnet, but it is more complex and works in a completely different way. The wind direction is measured using 8 different reed switches. There are also eight resistors in the wind vane, and as the magnet rotates, different reed switches will open and close and thus switch their corresponding resistor in and out of the circuit.
The wind speed is measured using an anemometer. A typical anemometer has three arms with scoops on the end that catch the wind and cause the arms to spin. This will cause the reed switch located on the bottom to trigger. We used the number of signals from the reed switch to calculate how fast the anemometer spins.
A wind gust is a brief increase in wind speed that can occur whenever the wind is blowing. A typical wind gust lasts less than 20 seconds. We implemented this by constantly taking wind speed measurements for five seconds, and temporarily storing them to be processed every few minutes.
7. - Lightning Distance: AS3935
The AS3935 is a programmable fully integrated Lightning Sensor IC that detects the presence and approach of potentially hazardous lightning activity in the vicinity and provides an estimation on the distance to the head of the storm. The AS3935 can also provide information on the noise level and inform the external unit (e.g. microcontroller) in case of high noise conditions, with the noise floor generator and noise floor evaluation blocks.
8. - UV Index: VMA328
The VMA328 is an analogue UV sensor module. It uses a UV photodiode, which can detect the 240-370 nm range of light (which covers UVB and most of UVA spectrum). The signal level from the photodiode is very small, in the nano-ampere level. The chip contains an operational amplifier to amplify this signal.
The data gathered from the sensor must be transformed into a digital signal before it can be read.
Database Details
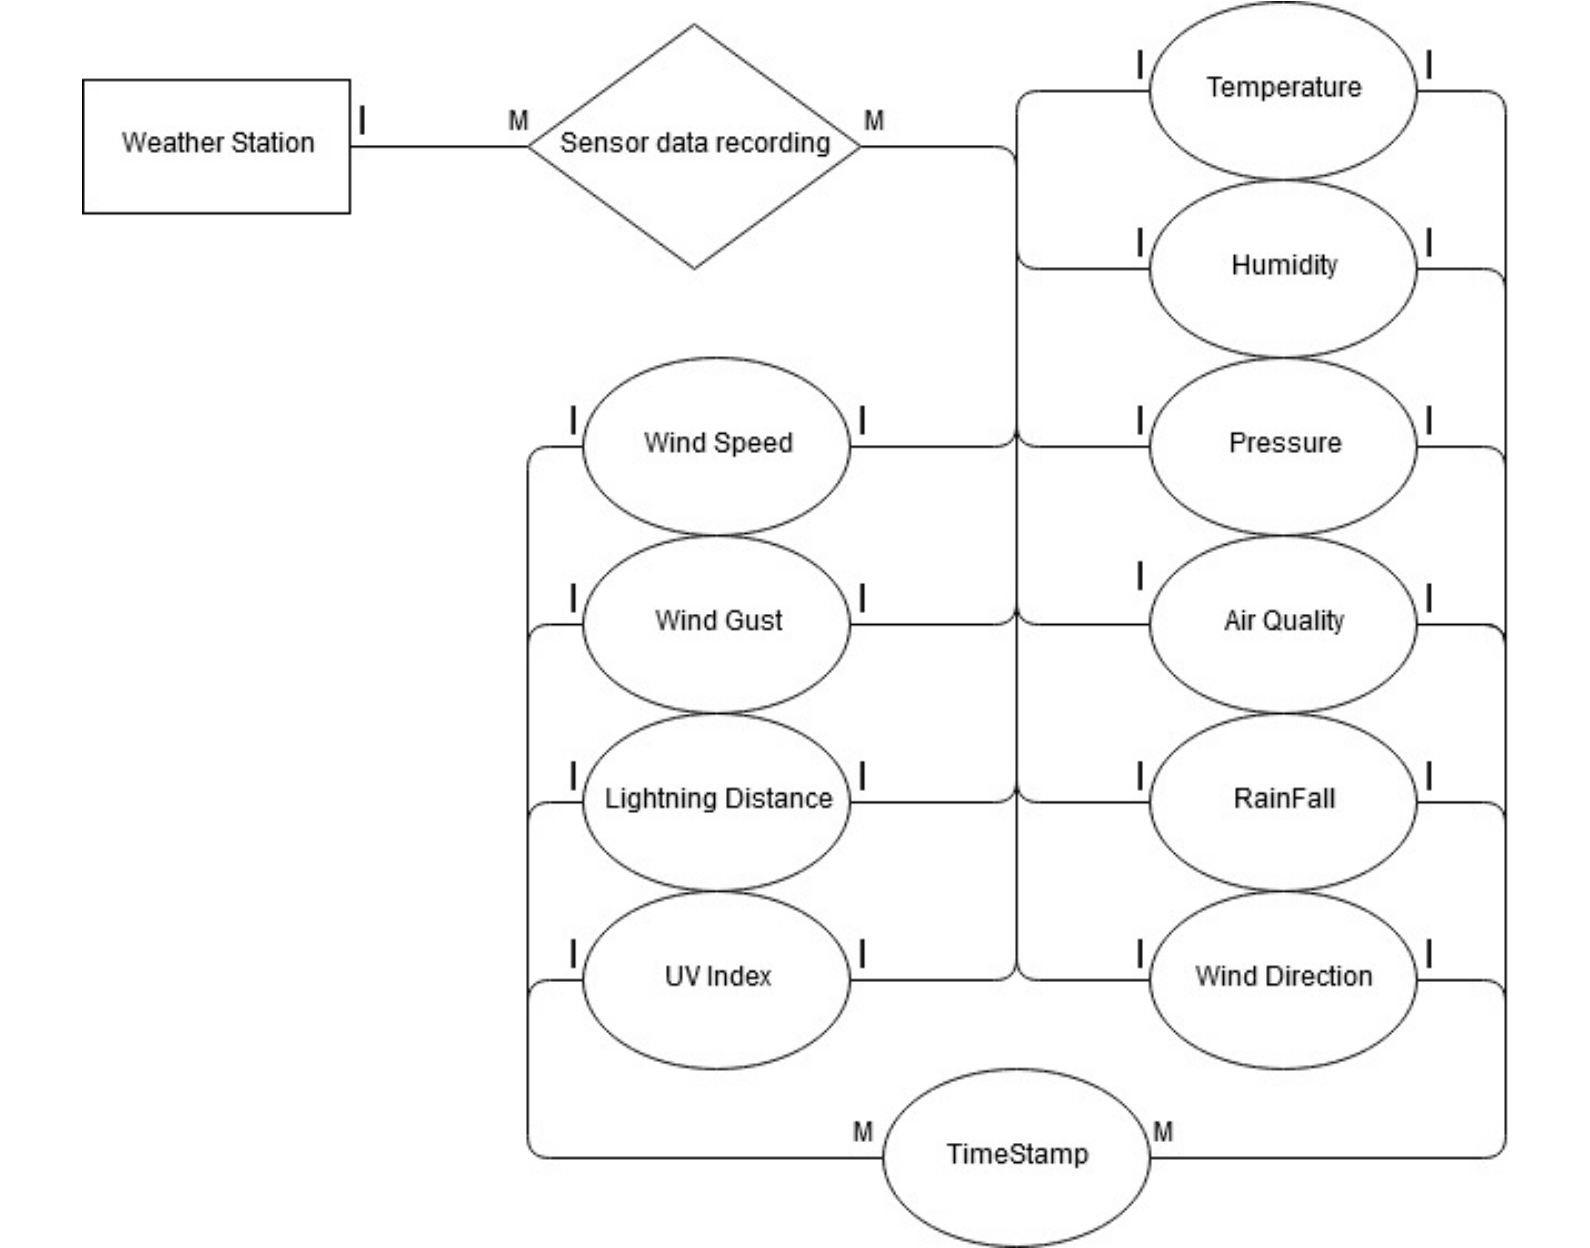
 Picture 10. Relational database ER diagram.
1. MySQL database
- Host = "dns.server.address"
- User = UserName
- Password = superSecretPassword
- Database = WeatherStation
Database structure
| Value Name | Type | | -------------- | --------- | | id | Int | | temperature | Decimal | | airpressure | Decimal | | humidity | Decimal | | winddirection | Varchar | | windspeed | Decimal | | windgust | Decimal | | air_quality | Decimal | | rainfall | Decimal | | lightning | Int | | uv | Int | | timestamp | Timestamp |
2. MongoDB database
- Client = mongodb://WeatherStation:weatherStation@dns.server.address:27017/weatherStation
- Client name = mongodbWeatherStation
- Collection (Database) = WeatherSensors
Database structure
| Value name | Value | Value name | Value | Value name | Value | | -------- | -------- | -------- | -------- |--------- |------ | | _id | | date | | Temperature | | | _id | | date | | Pressure | | | _id | | date | | Humidity | | | _id | | date | | Air Quality | | | _id | | date | | RainFall | | | _id | | date | | Windspeed | | | _id | | date | | Wind gust | | | _id | | date | | Wind Direction | | | _id | | date | | Lightning Distance | | | _id | | date | | UV | |
_id is generated automatically by MongoDB. Not visible in code.
3. InfluxDB time-series database
- Host = "dns.server.address"
- Port = 8086
- User = User
- Password = supersecretpassword
- Database = weatherStation
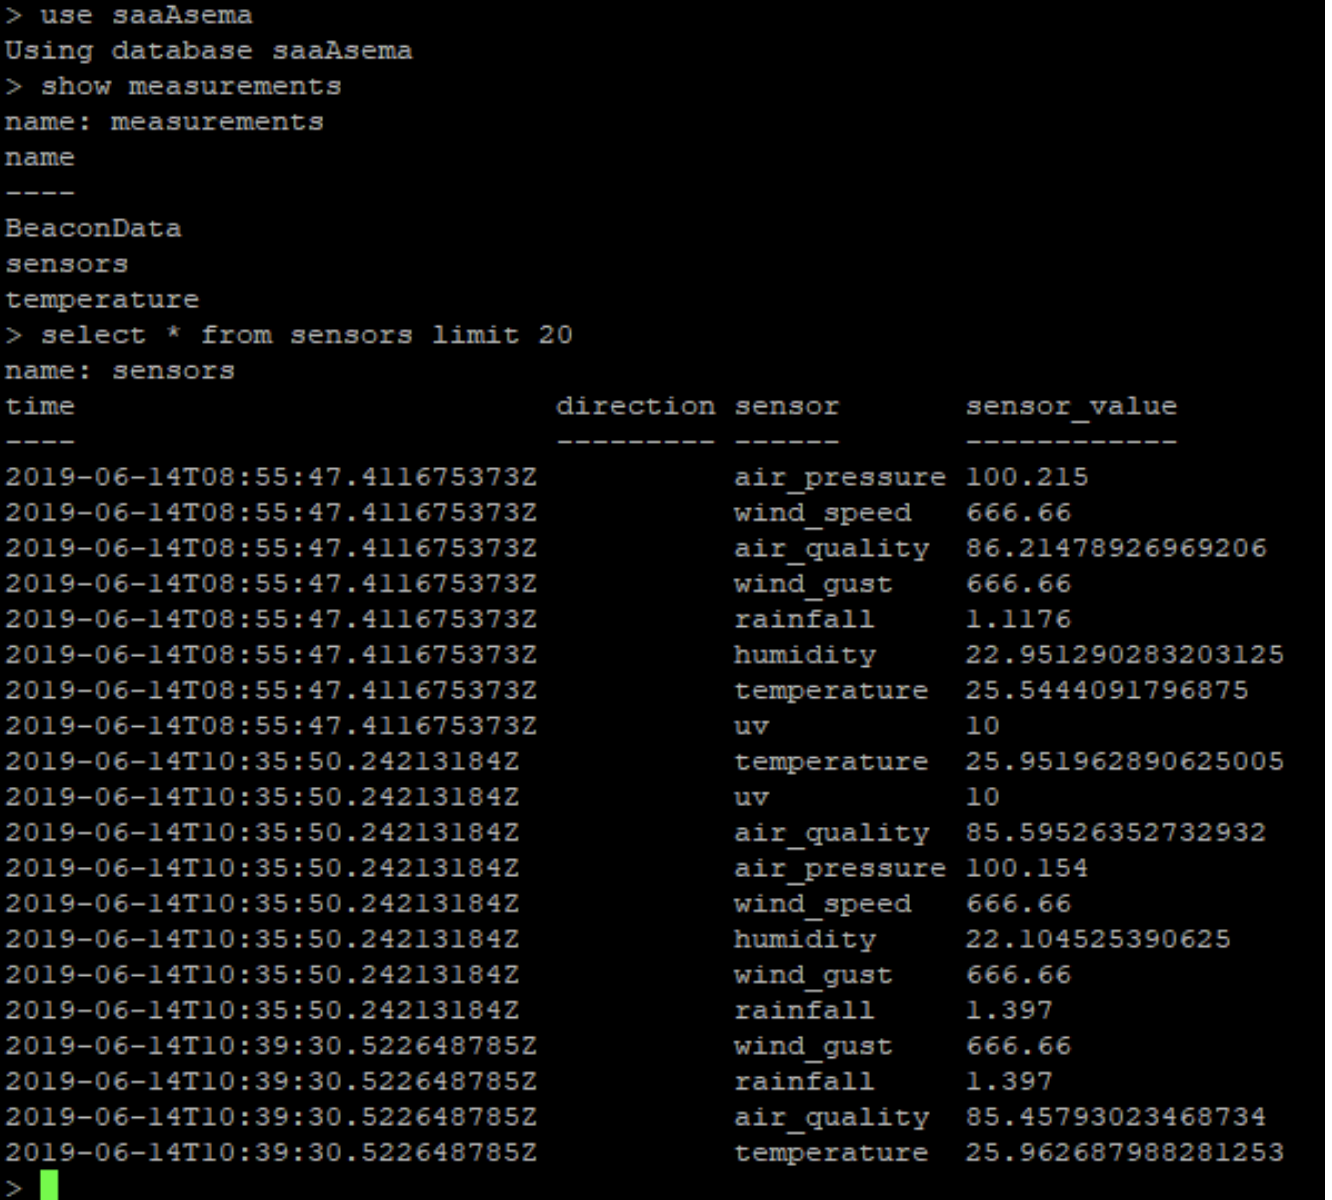
InfluxDB is a nonrelational, open-source time series database (TSDB) developed by InfluxData. It uses a SQL-like language to store data in a time series for ease of viewing. InfluxDB also includes built-in timestamps.

Picture 11. InfluxDB data.
Useful commands depends on InfluxDB
influx
auth
show databases
use [database]
show measurements
select * from [measurement]
select * from [measurement] limit 20
select * from [measurement] order by time desc limit 20
precision rfc3339
Flask Framework and API interface
Flask is a micro web framework written in Python. It is classified as a microframework because it does not require particular tools or libraries.
Flask has no database abstraction layer, form validation, or any other components where pre-existing third-party libraries provide common functions.
However, Flask supports extensions that can add application features as if they were implemented in Flask itself.
1. Flask RestApi
API stands for Application Programming Interface, and it refers to the mode of communication between any two software applications. An API is just a medium that lets two entities of code talk to each other.
Like API, REST is an acronym, and it stands of Representational State Transfer. It’s an architectural style for designing standards between computers, making it easier for systems to communicate with each other. In simpler terms, REST is a set of rules developers follow when they create APIs. A system is called RESTful when it adheres to these constraints.
2. Flask RestAPI in Weather Station project
The goal is to make a RestApi connection between our machine and weather station’s Raspberry Pi, so we can directly ask for sensor data from Raspberry Pi’s sensors.

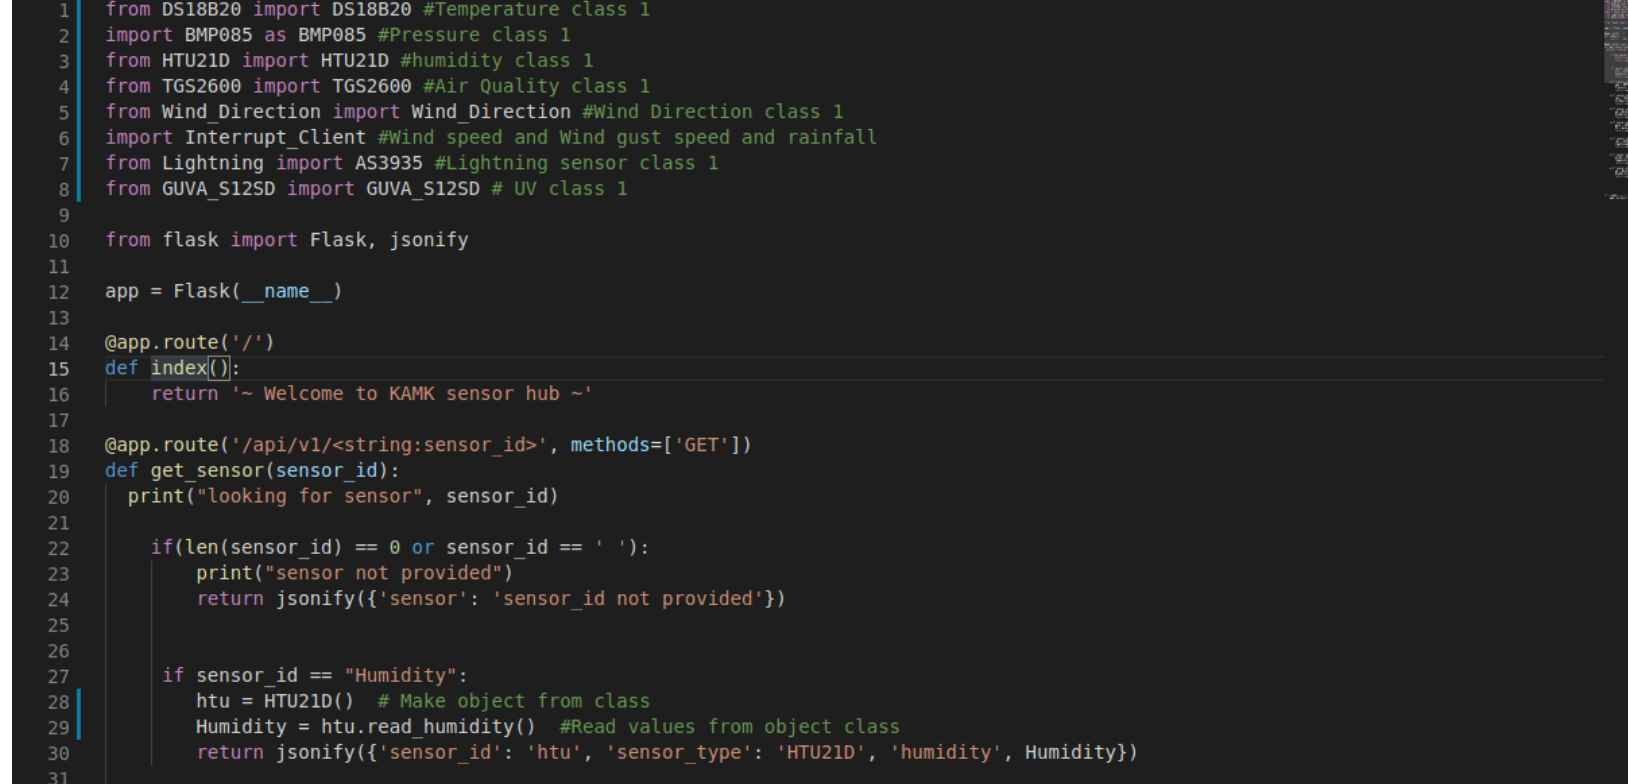
Picture 12. Flask code snippet.
Sensor code snippet where the sensor data provided in the FLASK API interface is created:
 if sensor_id == "Humidity": # if sensor_id matches with the following keyword...

        htu = HTU21D()  # Makes an object from class
        Humidity = htu.read_humidity()  # Read values from object class function
        return jsonify({'sensor_id': 'htu', 'sensor_type': 'HTU21D', 'humidity': Humidity}) # returns these values to the server

    elif sensor_id == "Temperature":

        ds18b = DS18B20()
        Temperature = ds18b.read_temp()
        return jsonify({'sensor_id': 'ds18b', 'sensor_type': 'DS18B20', 'temperature': Temperature})

    elif sensor_id == "Pressure":

        bmp = BMP085.BMP085()
        Pressure = bmp.get_pressure()
        return jsonify({'sensor_id': 'bmp', 'sensor_type': 'BMP085', 'pressure': Pressure})

    elif sensor_id == "AirQuality":

        tgs = TGS2600()
        AirQuality = tgs.get_airquality()
        return jsonify({'sensor_id': 'tgs', 'sensor_type': 'TGS2600', 'airquality': AirQuality})

    elif sensor_id == "Wind_Direction":

        wd = Wind_Direction()
        WindDirection = wd.get_direction()
        return jsonify({'sensor_id': 'wd', 'sensor_type': 'wd', 'wind_direction': WindDirection})

    '''
    elif sensor_id == "UV":
        guva = GUVA_S12SD()
        UV = guva.get_UV()
        return jsonify({'sensor_id': 'guva', 'sensor_type': 'GUVA_S12SD', 'uv': UV})

    elif sensor_id == "LightningDistance":
        lgt = AS3935()
        LightningDistance = lgt.get_lightning_distance()
        return jsonify({'sensor_id': 'lgt', 'sensor_type': 'AS3935', 'lightningdistance': LightningDistance})
    '''
3. Flask components, features and dependencies
Components
The microframework Flask is based on the Pocoo projects Werkzeug and Jinja2.
Werkzeug
Werkzeug is a utility library for the Python programming language, in other words a toolkit for Web Server Gateway Interface (WSGI) applications, and is licensed under a BSD License.
Jinja
Jinja, also by Ronacher, is a template engine for the Python programming language and is licensed under a BSD License. Similar to the Django web framework, it provides that templates are evaluated in a sandbox.
Features
- Contains development server and debugger
- Integrated support for unit testing
- RESTful request dispatching
- And many more..
Dependencies
- Werkzeug - implements WSGI, the standard Python interface between applications and servers.
- Jinja - is a template language that renders the pages your application serves.
- MarkupSafe - comes with Jinja. It escapes untrusted input when rendering templates to avoid injection attacks.
- ItsDangerous - securely signs data to ensure its integrity. This is used to protect Flask’s session cookie.
- Click - is a framework for writing command line applications. It provides the flask command and allows adding custom management commands.
- And few optional dependencies…
In simple words, a framework is anything that helps you complete your work faster.
Grafana dashboard
Grafana is an open-source platform for monitoring and observability. It is used for visualizing stored data in the InfluxDB database. Grafana is based on dashboards, which can display different types of data in many visual formats, such as heatmaps or graphs. These dashboards can then be shared or displayed. Grafana also supports Graphite, Prometheus, AWS CloudWatch and more.
The dashboards used in the project can be accessed here.
Port number 3000 is the default HTTP port that Grafana listens to if a different port hasn't been configured. Before adding any dashboards or graphs, a data source has to be configured in Configure -> Data Sources.
The weather station graph is updated every 5 minutes, while the data is uploaded every 10 minutes from the Raspberry Pi. Most of the data is directly uploaded from InfluxDB, except for rainfall, which is calculated as per hour.
Summary
Basic IoT prototyping skills that enable students to design and build simple devices based on their own innovation can be taught in a four-day-workshop. Prior embedded system experience is not compulsory, but lack of it calls for smaller workshop size and more personal support from a teacher or teachers for each student.
The setup and the architecture used were suitable for teaching IoT and building rapid prototypes. As there was no need for server programming, students could focus on their embedded system development. After students understood the concept of input, processing and output, it was simple to move from developing embedded systems to IoT devices.
The text output of the Python proxy program and Arduino IDE’s serial monitor helped debugging and developing the prototype considerably. Using GET and POST to send and receive data turned out to be easy to understand for students and bypassed many network limitations.
Utilized prototyping cycle and setup is considerably faster for developing programs for ESP8266 or ESP32 than uploading code directly to it. The upload time from Arduino IDE to ESP32 was 750% of the upload time to Arduino. Devices can be first developed and tested with a computer combined with Arduino, and then easily ported to ESP based boards. Longer courses would also allow prototyping more complex and finalized IoT devices than the ones built during the case Weather Station workshop.
Sources
Sensors:
- DS18B20: https://datasheets.maximintegrated.com/en/ds/DS18B20.pdf
- BMP085: https://www.sparkfun.com/datasheets/Components/General/BST-BMP085-DS000-05.pdf
- HTU21D: https://www.mouser.fi/pdfdocs/HTU21DF.PDF
- TGS2600: https://www.figaro.co.jp/en/product/docs/tgs2600_product_information_rev02.pdf
- AS3935:https://www.mouser.com/datasheet/2/588/ams_AS3935_Datasheet_EN_v5-1214568.pdf
- VMA328:https://www.robotshop.com/media/files/pdf/uv-light-sensor-guva-s12sd-datasheet1.pdf
Flask Framework: http://flask.palletsprojects.com/en/1.1.x/
Hardware:
Grafana: https://grafana.com/docs/